Die Last eines Terminalservers wird in der Welt von Citrix Virtual Apps and Desktops mittels des Load Indexes angegeben. Dieser Wert geht von 0 (0% – keine Last) bis 10’000 (100% – Volllast). Volllast bedeutet ja noch nicht zwingend, dass ein Server keine Luft mehr hat, dennoch kann sich kein neuer Benutzer mehr anmelden.
Da wir die Berechnungskriterien für den Load Index selbst definieren können (z.B. CPU, RAM, Anzahl Benutzer), können wir uns im Monitoring nicht auf einen uns bekannten Wert wie z.B. die Prozessorlast verlassen.
Ich hatte daher die Idee einen Sensor zu erstellen, welcher für jede Bereitstellungsgruppe die durchschnittliche Last anhand des Load Indexes berechnet uns ausgibt.
Der Sensor selbst wird im PRTG innerhalb des Citrix Controllers erstellt und nicht pro Worker.
Im ersten Schritt werden alle Bereitstellungsgruppen vom Controller ausgelesen und in einem Array gespeichert. Es wird hier bereits geprüft, ob eine Bereitstellungsgruppe ggf. im Wartungsmodus ist.
###
# Prepare an array of all delivery groups from a Citrix controller by an Invoke-Command
# Citrix PS commands are only available on those servers
$Data = $null
$Data=@()

$Data += Invoke-Command -Computername $server -credential $credentials -ScriptBlock {

    # Load Citrix PS Snapin
    add-pssnapin citrix*

    # Get delivery groups with the needed information
    $DeliveryGroups=Get-BrokerDesktopGroup | Select-Object Name, InMaintenanceMode

    # Set the array for later work
    $DG=@()
    ForEach ($group in $DeliveryGroups){
       $DG += [PSCustomObject]@{Name=$group.Name;InMaintenance=$group.InMaintenanceMode}
    }

    # Return data to PRTG probe
    return $DG
}
Im weiteren Schritt wird jede einzelne Bereitstellungsgruppe (DG) abgearbeitet. Ist eine DG im Wartungsmodus, dann wird ein pseudo Load Index von 99/9% zurück gegeben, damit im Monitoring kein Alarm ausgelöst wird.
Jede weitere DG wird nun erneut beim Controller abgefragt. Nun werden jedoch sämtliche Worker mit ihrem aktuellen Load Index Wert in einen Array gespeichert. Danach wird die Summe aller Lastwerte errechnet und durch die Anzahl Worker geteilt (einfache Mathematik ^^) und zu guter Letzt der Prozentwert auf eine Zahl ohne Komma gerundet, da PRTG keine Kommawerte in einem Prozentfeld ausgeben kann.
Diese Daten werden in einen weiteren Array geschrieben, welcher im Anschluss benutzt wird um die PRTG Ausgabe zu erstellen:
###
# Prepare an array of the load of all delivery groups from a Citrix controller by an Invoke-Command
# Citrix PS commands are only available on those servers
$Load = $null
$Load=@()

ForEach ($RDSHGrp in $Data) {

    $RDSHArg = $null
    $RDSHArg = $RDSHGrp.Name

    # Determine if a delivery group is in maintenance
    # DGs in maintenance goes into warning state, but doesn't affect the whole sensor
    # DGs in maintenance will not be stated based on her usage
    # DGs in maintenance will have fake values of 9% and 99 to avoid an alarm
    If ($RDSHGrp.InMaintenance) {
        $RDSHWorkers=99
        $RDSHTotalLoad=99
        $RDSHAvgLoad=99
        $RDSHAvgPercent=9
    }
    Else {
        $RDSHLoad = $null
        $RDSHLoad = @()


        $RDSHScriptBlock =
            {
                 # Load Citrix PS Snapin
                add-pssnapin citrix*

                # Get delivery groups with the needed information
                $RDSHWorker=Get-BrokerMachine | Where-Object DesktopGroupName -eq $args[0] | Select-Object DNSName, LoadIndex

                # Set the array for later work
                $RDSH=@()
                ForEach ($Worker in $RDSHWorker){
                   $RDSH += [PSCustomObject]@{Name=$Worker.DNSName;Load=$Worker.LoadIndex}
                }

                # Return data to PRTG probe
                return $RDSH
             }

        # Get the load index of all workers in the delivery group
        $RDSHLoad += Invoke-Command -Computername $server -credential $credentials -ScriptBlock $RDSHScriptBlock -ArgumentList $RDSHArg

        # Count the workers
        $RDSHWorkers = $RDSHLoad.count
        $RDSHTotalLoad = 0
        # Calculate the sum of all load indexes
        $RDSHLoad.Load | ForEach{$RDSHTotalLoad += $_}
        # Calculate the average load index for the delivery group
        $RDSHAvgLoad = "{0:F0}" -f ($RDSHTotalLoad/$RDSHWorkers)
        # Calculate the average percent value of the load index for the delivery group
        $RDSHAvgPercent = "{0:F0}" -f ($RDSHAvgLoad/100)

    }
    $Load += [PSCustomObject]@{Name=$RDSHArg;Worker=$RDSHWorkers;TotalLoad=$RDSHTotalLoad;AvgLoad=$RDSHAvgLoad;AvgPercent=$RDSHAvgPercent}
}
Die PRTG Ausgabe selbst ist durch die vorherigen Berechnungen keine Raketenwissenschaft mehr:
###
# Prepare the data and the PRTG XML output

# Reset some variables and define standard values
$returnState=$null
$returnState=@()
$returnStateOK = 0
$returnStateWarning = 1
$returnStateCritical = 2
$AlertLevel=90
$AlertString = "ALERT - high load index"
$WarningLevel=80
$WarningString = "Warning - load index reaches a high level"

# Start preparing XML output
$retXml = "<prtg>`n"

# Get data for each delivery group from the array created on the Citrix Controller
ForEach ($Dataset in $Load){
    # Prepare variables based on the array data
    $DGName = $Dataset.Name
    $DGTotal = $Dataset.Worker
    $DGLoad = $Dataset.AvgLoad
    # Calculate the percentage of the RDSH delivery groups
    $DGLoadPercent = $Dataset.AvgPercent
    $DGMaintenance = $Dataset.Maintenance

    # Determine return state if delivery group is not in maintenance
    # The values depend on the size of the delivery group
    If ([Int64]$DGLoadPercent -gt $AlertLevel){
        $RetState = $returnStateCritical
        $returnState += [PSCustomObject]@{Name=$DGName;State=[Int64]$RetState}
    }
    ElseIf ([Int64]$DGLoadPercent -le $WarningLevel) {
        $RetState = $returnStateOK
        $returnState += [PSCustomObject]@{Name=$DGName;State=[Int64]$RetState}
    }
    Else {
        $RetState = $returnStateWarning
        $returnState += [PSCustomObject]@{Name=$DGName;State=[Int64]$RetState}
    }


    #$retXml += "  <result>`n"
    #$retXml += "    <channel>$DGName State</channel>`n"
    #$retXml += "    <value>$RetState</value>`n"
    #$retXml += "  </result>`n"
    $retXml += "  <result>`n"
    $retXml += "    <channel>$DGName Load %</channel>`n"
    $retXml += "    <value>$DGLoadPercent</value>`n"
    $retXml += "    <unit>Percent</unit>`n"
    $retXml += "    <limitMode>1</limitMode>`n"
    $retXml += "    <limitMaxError>$AlertLevel</limitMaxError>`n"
    $retXml += "    <limitErrorMsg>$AlertString</limitErrorMsg>`n"
    $retXml += "    <limitMaxWarning>$WarningLevel</limitMaxWarning>`n"
    $retXml += "    <limitWarningMsg>$WarningString</limitWarningMsg>`n"
    $retXml += "  </result>`n"
    $retXml += "  <result>`n"
    $retXml += "    <channel>$DGName Load Index</channel>`n"
    $retXml += "    <value>$DGLoad</value>`n"
    $retXml += "    <unit>Count</unit>`n"
    $retXml += "  </result>`n"
}

# Determine return string depends on the several states
If ($returnState.State -contains 2) {
    $RetString = $AlertString
}
ElseIf ($returnState.State -contains 1) {
    $RetString = $WarningString
}
Else {
    $RetString = "OK"
}

$retXml += "  <text>$RetString</text>`n"
$retXml += "</prtg>`n"

###
# Return info to PRTG
write-host $retXml
Das Ergebnis sieht dann wie folgt aus:
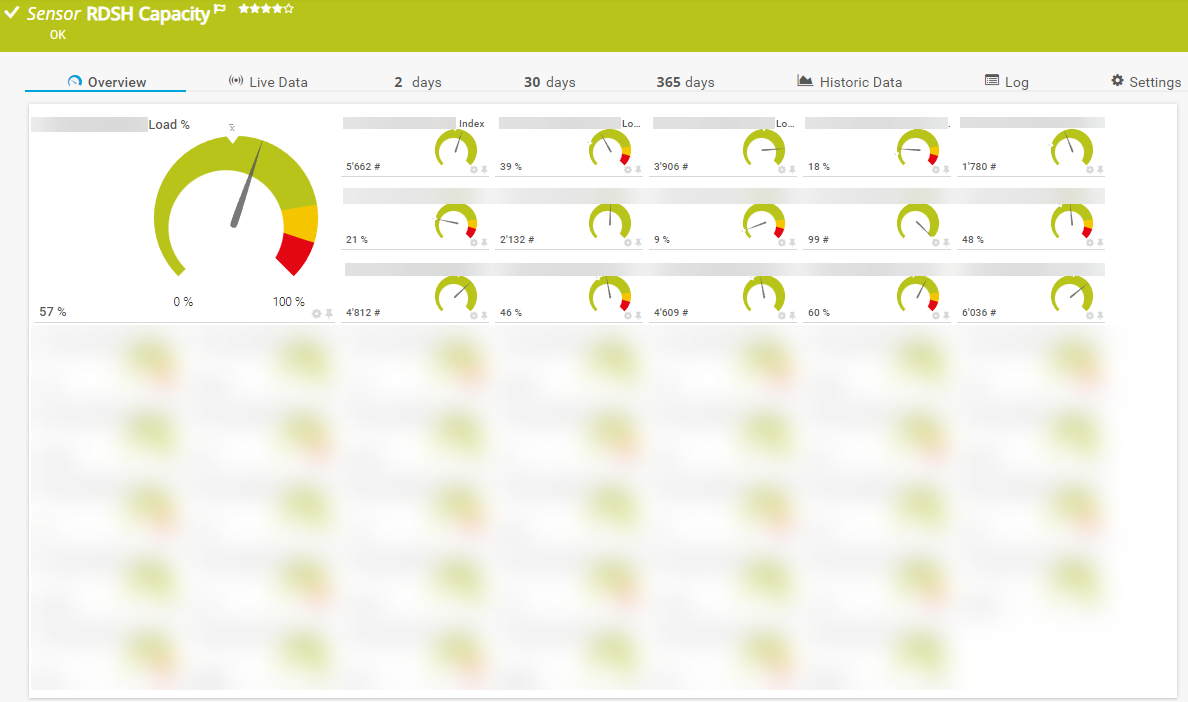
Viel Spass beim Nachbauen. :-)